

Strategy Modeling and Data Visualization
Strategy Modeling and Impact Analysis

Strategy Modeling
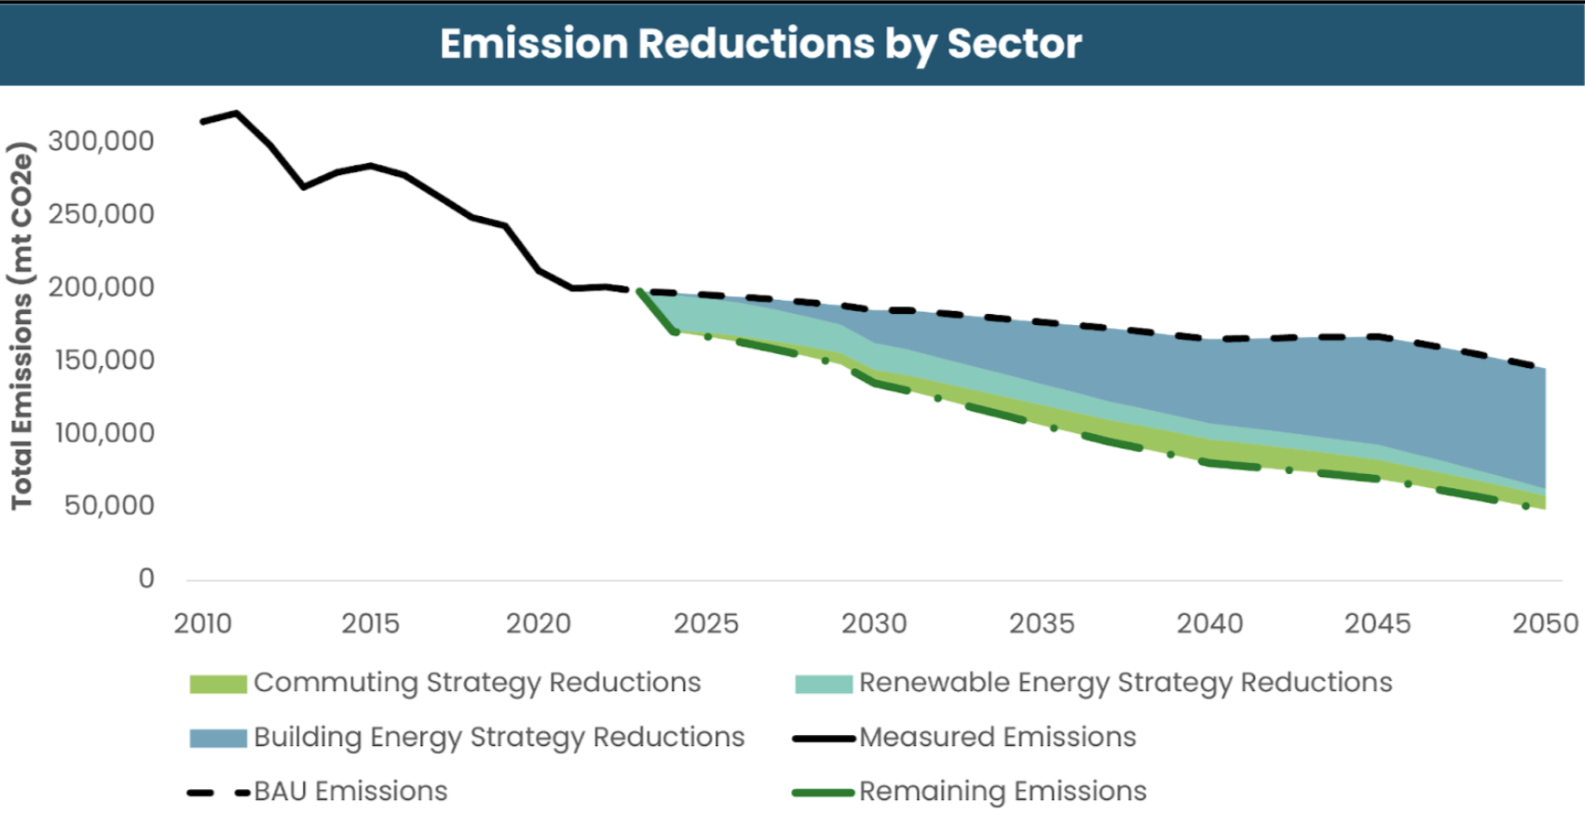
We Provide Modeled Emission Pathways That Compare Baseline Scenarios to Policy and Action Impacts.
We have modeled strategies across every sector of GHG emissions that can account for both emissions reductions and costs. Clients use our models to bridge the gap between where they are and where they want to be. Our modeling outputs provide thousands of data points that can be incorporated into dashboards, visualizations, or other materials to engage the public, stakeholders, and policymakers.
Business as Usual (BAU) models present clients with a clear picture of where their emissions will be in the future if no further action is taken. Incorporating known impacts identifies the externalities, like population growth or federal/state vehicle emission standards, and creates a backdrop for modeling additional strategies and their impact.
We quantify GHG emissions impacts of policy and actions. We use robust data to assess the impact of cost-effective mitigation policies and programs on the BAU scenario and identify strategies that will create the largest reduction in GHG emissions. In addition, our tools help set and monitor progress towards policy GHG emission reduction goals.
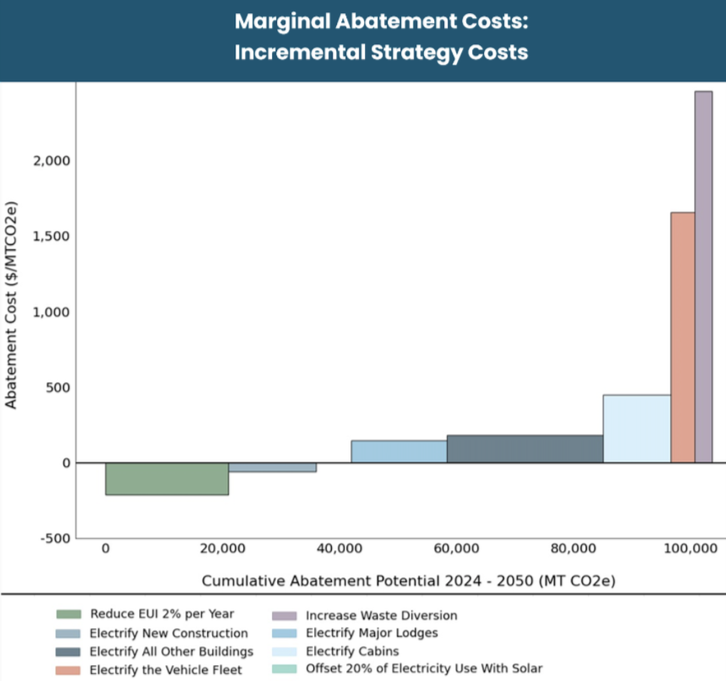
We develop detailed cost models to help for an additional layer of consideration. We analyze and review strategies, not only for their emissions’ impact, but also to understand the investment required to fully realize those reductions. Costs are further broken out by capital cost, program costs, and can include social costs of GHG emissions and co-pollutants.
Data visuals
We translate technical findings so that the general public can understand the results. We are experts at taking technical information and explaining it to the general public, board members, and elected officials. We create visualizations and dashboards that allow the general public to understand our client’s impacts. Some examples of data visualizations that Lotus created for clients below!
INteractive dashboards
Our experts have the ability to create engaging, interactive data dashboards using ESRI’s ArcGIS Online, Tableau, and Microsoft PowerBI.
Explore More Lotus-Built Dashboards
PROGRAM IMPACT REPORTING AND EVALUATION TOOLS
Lotus offers program impact evaluation tools as part of our suite of modeling and data visualization services. Program impact evaluation tools make it simple and efficient to comply with State and Federal reporting requirements, especially when new funding becomes available. Lotus has applied these tools to effectively measure and communicate impacts for green banks, grant programs, and Community Development Financial Institutions.
Lotus breaks program impact evaluations into four steps.
Background research and metric identification.
a) Metrics can include GHG emissions reductions, energy use and cost reductions, jobs created, impacts in disproportionately impacted communities, etc.
Data collection.
Calculation and development of summary dashboard.
Reporting and sharing results with stakeholders
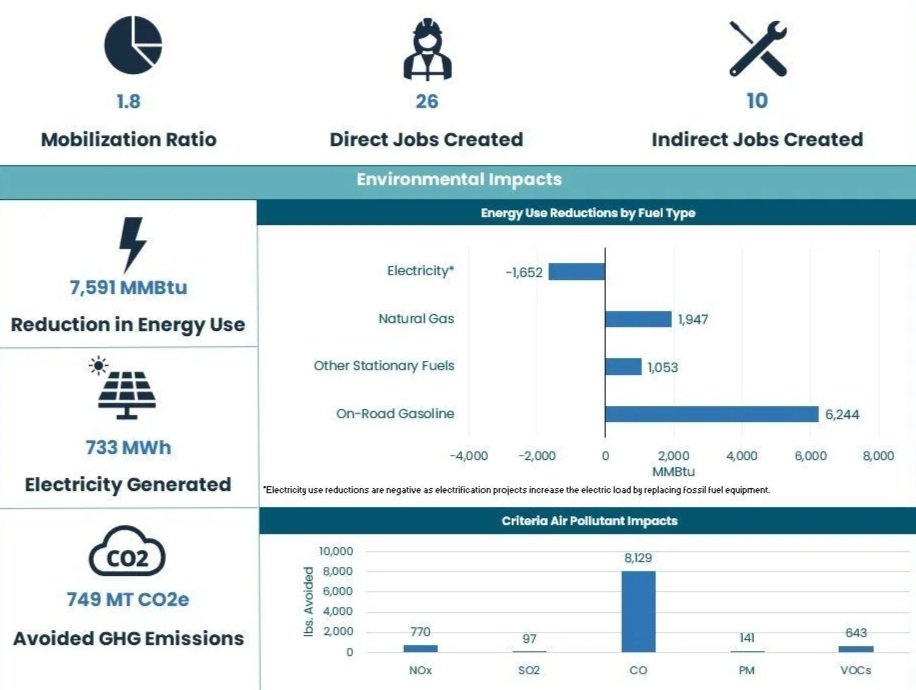
Sample program impact dashboard summarizing impacts of program implementation on energy use, emissions, air pollution, and jobs.

Collective Clean Energy Fund (CCEF)
“The Lotus Engineering & Sustainability team developed a comprehensive, easy-to-use impact measurement tool for the Colorado Clean Energy Fund (CCEF). The entire engagement with Lotus was well-organized and cost effective, and we were amazed by how sophisticated the end product was. Thanks to the tireless effort by the team at Lotus, CCEF is now able to efficiently track and calculate its economic, environmental, and social impact across its portfolio. CCEF could not have achieved this without the help of Lotus!”